OData - Excel and Power BI
Introduction
The Brightly Assetic OData endpoint may be accessed for reporting using Microsoft Excel and Microsoft Power BI (among other tools).
Both of these application use Microsoft Query, which means the configuration of these applications to use the Assetic OData endpoint is the same. This article will detail how to perform this configuration, using Excel, but where Power BI differs then an example using Power BI will also be included.
Refer to the article Reporting Introduction for more information about the Brightly Assetic OData implementation. Refer to the article OData-endpoint for more information on the OData query syntax.
NOTE Microsoft Excel versions that support OData version 4.0 are required. Excel 2016 has OData v4.0 support. The following screenshot shows the OData connection dialog from versions of Excel prior to Excel 2016.
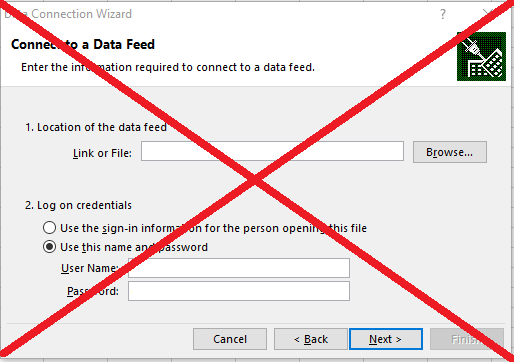
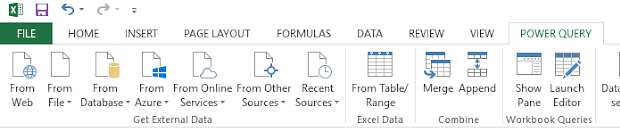
This connection for OData version 2.0 and is not supported. An Excel add-in is available from Microsoft that supports OData v4.0 - Microsoft Power Query. Once installed there will be a new tab titled 'Power Query'. Use this to access OData.
This article provides a step by step guide to using either Microsoft Excel or Microsoft Power Builder with the Assetic OData endpoint.
Sample Spreadsheet and Report
The sample Excel spreadsheet and Power BI report used in the screenshots for this article are available for you to download.
You can follow steps 11 and 12 to use these reports in your own Brightly Assetic environment.
The Power BI report is configured in Power BI Desktop, but may be published to a Power BI Service for report sharing.
Report Creation
Report Creation is broken down into the following key steps:
1. Create New OData Query
2. Authentication to Assetic
3. Column Selection
4. Load Selected Data into Spreadsheet/Report
5. Data Refresh
6. Query Name
7. Define the Number of Records to Return
8. Search Filter
9. Setting Search Filter via Advanced Editor
10. Setting Search Filter by Query Parameter
Data Aggregation
11. Create New Aggregation Query
Additional Tasks
12. Change OData Source
13. Reset Authentication Credentials
1. Create New OData Query
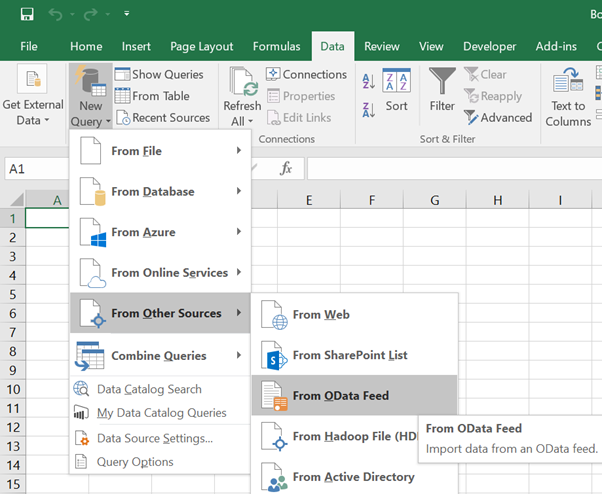
Excel: In a new workbook go to the “Data” tab and choose the “New Query”->”From Other Sources”->”From OData Feed” menu option.
Power BI: In a new report go to the "Home" tab and choose "Get Data"->"OData Feed"
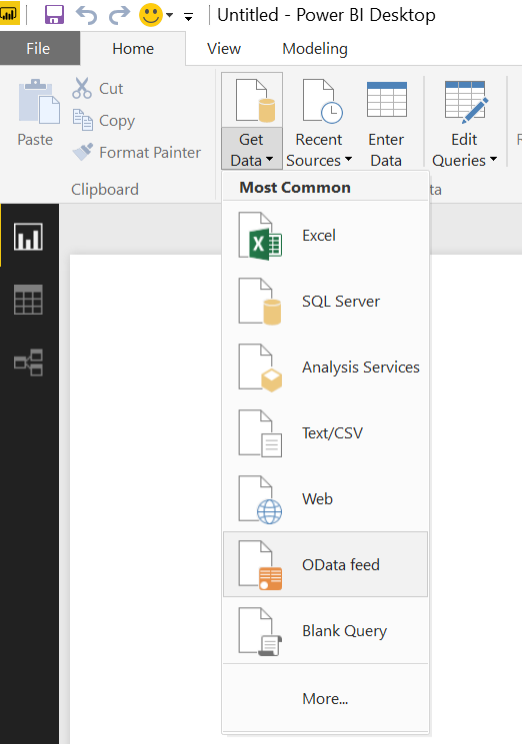
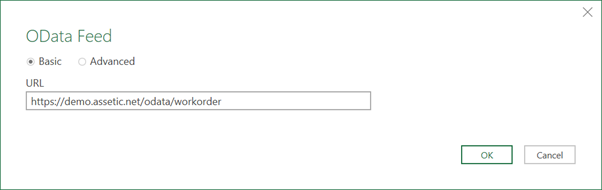
For both Excel and Power BI an “OData Feed” dialog window will pop-up after choosing the "OData Feed" menu option. This is where the Assetic OData resource URL is entered.
The OData endpoints are as follows (replace “[your_site]” with your Assetic URL):
|
Resource |
URL |
|
Asset |
https://[your_site]/odata/assets |
|
Component |
https://[your_site]/odata/component |
|
Network Measure |
https://[your_site]/odata/networkmeasure |
|
Fair Valuation |
https://[your_site]/odata/fairvaluation |
|
Service Criteria |
https://[your_site]/odata/servicecriteria |
|
Treatments |
https://[your_site]/odata/treatments |
|
Work Order |
https://[your_site]/odata/workorder |
|
Work Request |
https://[your_site]/odata/workrequest |
Enter one of the URL endpoints from the table above into the dialog window as shown in the screenshot below, and then hit OK:
2. Authentication to Assetic
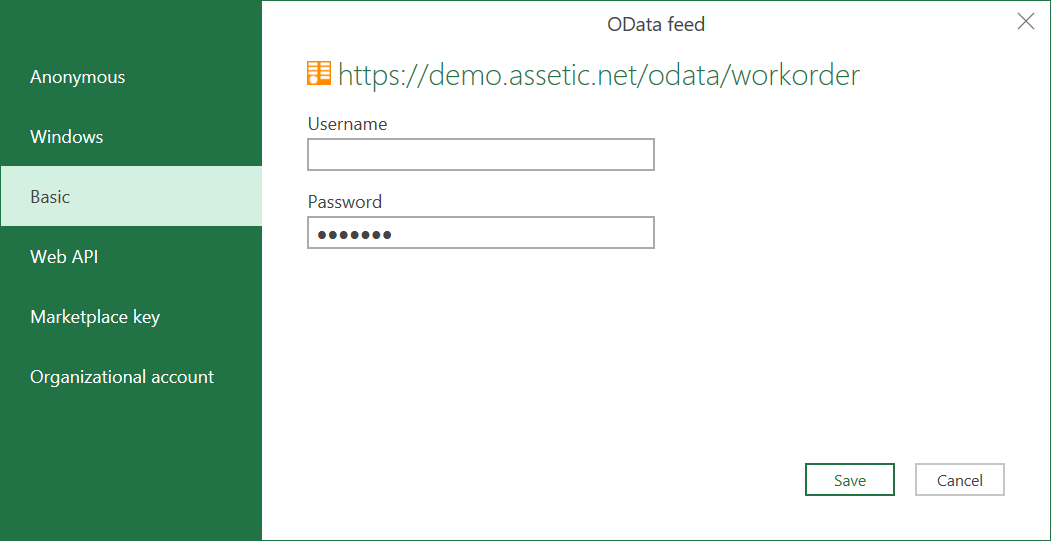
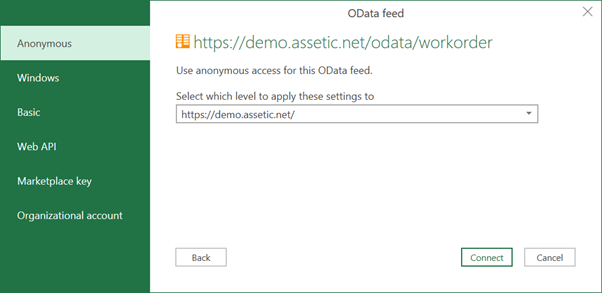
A new dialogue window will popup, prompting you to authenticate to Assetic. By default it is set to “Anonymous” login.
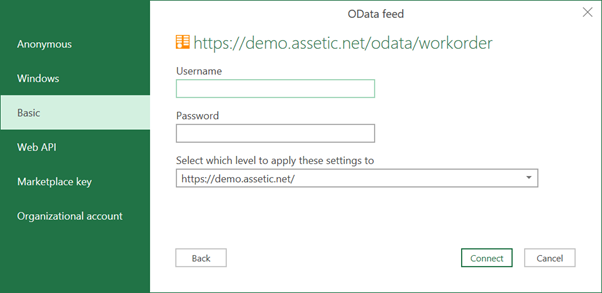
Change the login type to “Basic” by clicking on “Basic”. Enter your Assetic “Username” and “Password” and select “Connect”
If SSO authentication is used in an environment, then in order to authenticate, first you log into the Assetic UI via SSO, then you append /api/v2/auth/token to the URL:
e.g. https://<organisation>.assetic.net/api/v2/auth/token
This will give you a token to use as the password when connecting to Power BI. You still use 'Basic' authentication, and your email address is still the 'user name'.
The token does not expire, however each time you access /api/v2/auth/token the prior token is deleted.
If you also logs in via Assetic Mobility the token will be reset and no longer work for Power BI, as Assetic Mobility also uses /api/v2/auth/token to get a token.
3. Column Selection
If the connection is successful, the next dialog window to pop up is a grid listing all the fields (columns) available in the endpoint. There is no data shown at this point.
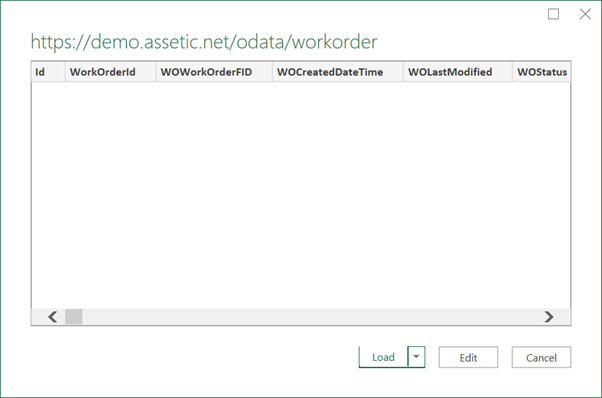
Choose “Edit”. A new “Query Editor” dialog window will popup.
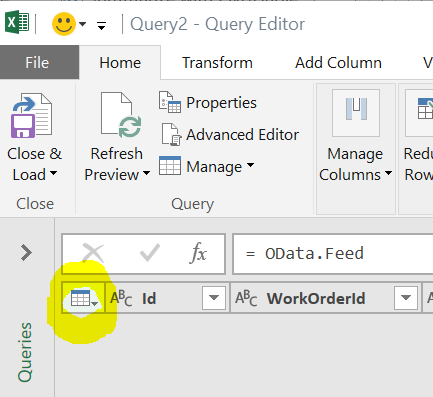
At this stage the fields required to report in Excel need to be chosen. This ensures that only the required data is downloaded from Assetic which makes the download smaller and faster.
In the top left corner of the query grid is a grid options icon (highlighted in screenshot below). Click on this icon to get a list of options.
One of the grid options is ‘Choose Columns’. Pick this option:
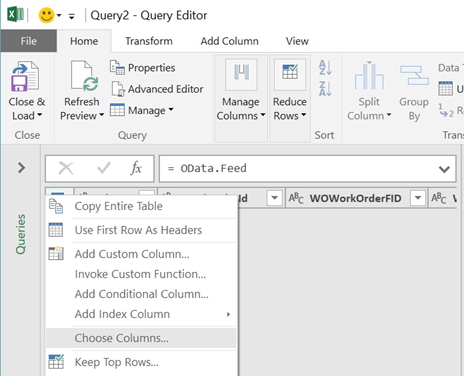
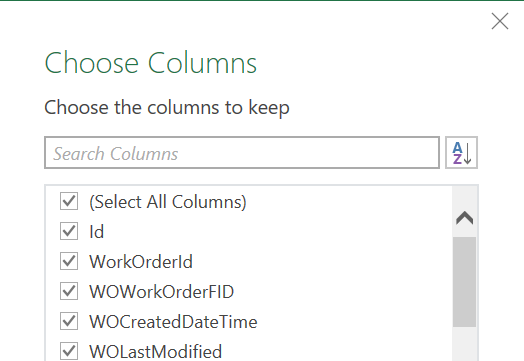
A new dialog window pops up with a list of columns.
First deselect the option (“Select All Columns”), and then tick just the columns you want in your report.
After choosing the columns required in the report choose OK. The “Query Editor” dialog window will refresh and show data in the grid.
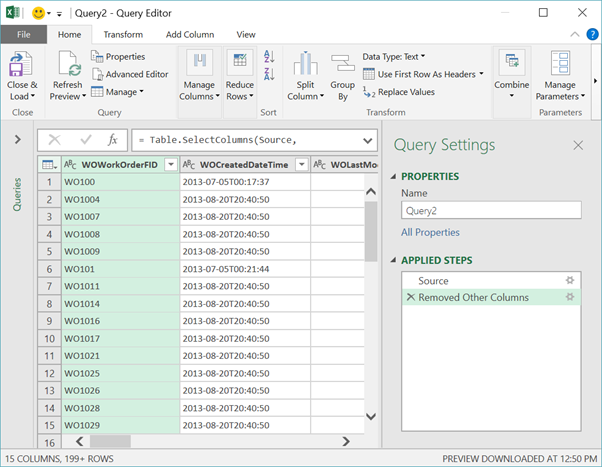
No Data Loaded
If no data is shown in the grid it may be due to a recent implementation feature introduced by Microsoft (mid-2018). To check if that new feature is the cause choose the "Advanced Editor" button to open the "Advanced Editor" dialog window.
The "Advanced Editor" shows the OData query it has built.
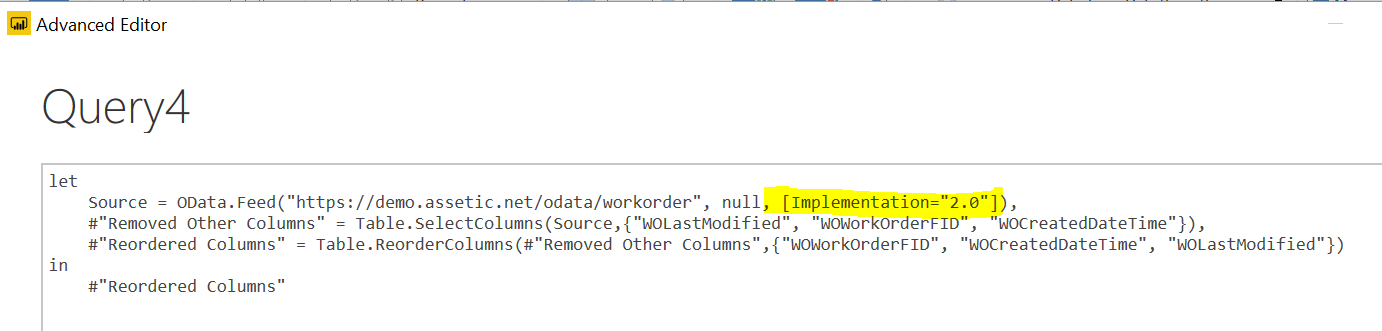
If you see the text '[Implementation="2.0"]' it means the Microsoft feature has caused the issue by defaulting the OData connector to their version '2.0'. To resolve this issue, remove the following from the query (highlighted in the screenshot above):
", [Implementation="2.0"]"
The query should now look as shown in the screenshot below:
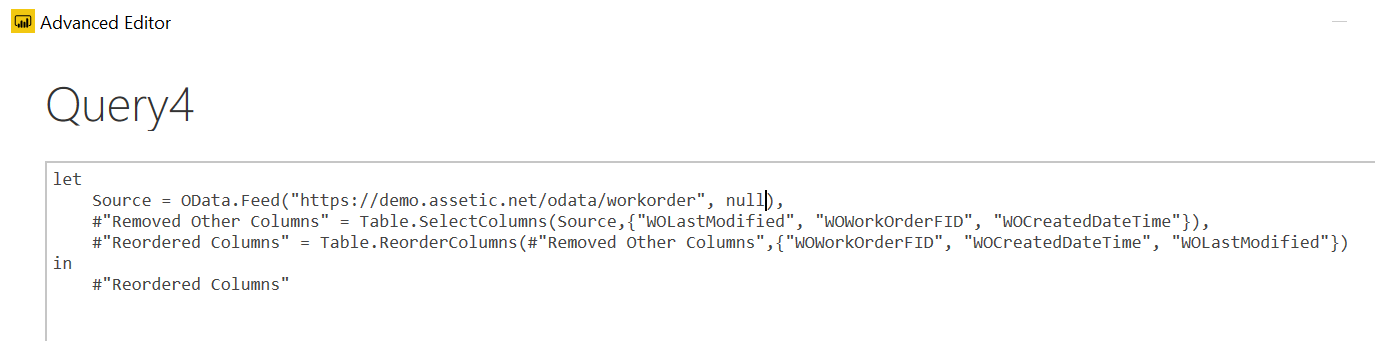
Click on the 'Done' button to save the change. The data grid should refresh and show data.
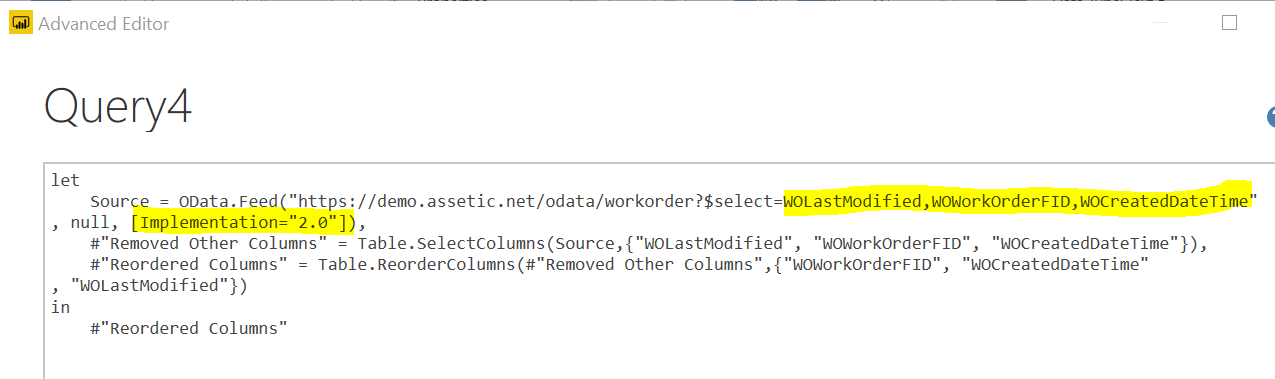
An alternate solution is to include the fields that you are planning to query in the OData URL 'Source' definition, as shown in the screenshot below. The fields can also be included in the URL entered in Step 1 Create New OData Query rather than doing via the advanced editor.
If there is still no data, or there was no text '[Implementation="2.0"]' in the query then use Assetic Advanced Search module to verify that there are if fact records to return.
4. Load Selected Data into Spreadsheet/Report
Excel: From the “Query Editor” choose “Close and Load” to display the Assetic data in the Excel spreadsheet.
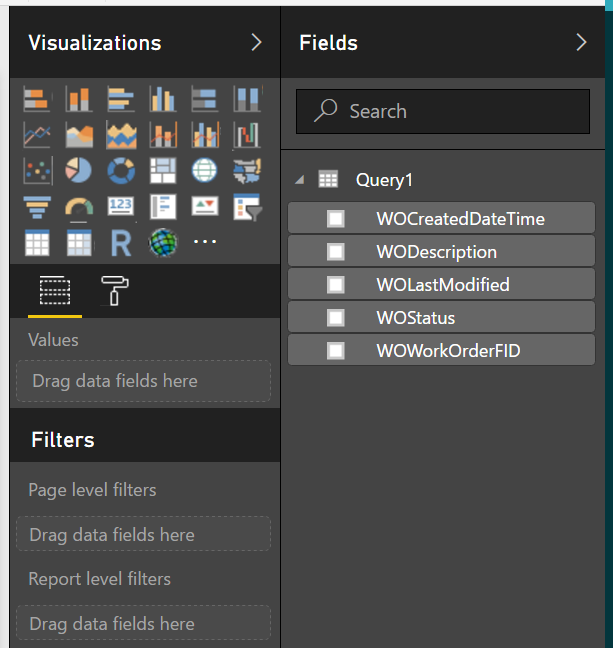
Power BI: From the “Query Editor” choose “Close and Apply”. A panel on the right hand side of Power BI will list the fields underneath the query name ("Query1" in this example). These fields can be dragged into the report, alternatively ticking the box next to each field will also add the field to the report. The data is added to the report as a 'Table'. There are many other ways to use the use the data in a Power BI report.
5. Data Refresh
The data loaded into the spreadsheet/report is not automatically updated to reflect changes to the data that may have occurred since it was loaded. This is to reduce unnecessary downloading of data.
This means you need to 'Refresh' the data whenever you want to see the most current information.
Even if you close Excel/Power BI and re-open the application the data will not be refreshed.
NOTE If you have published your report to Power BI on the web then you can configure a nightly refresh of the data in the web report.
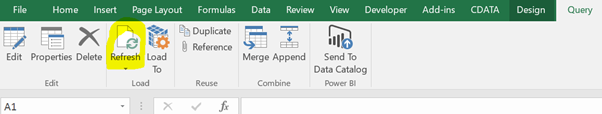
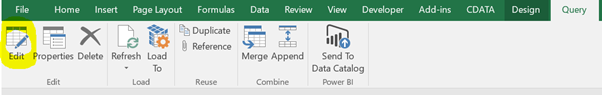
Excel: Use the menu option “Refresh” under the “Query” tab to refresh the data.
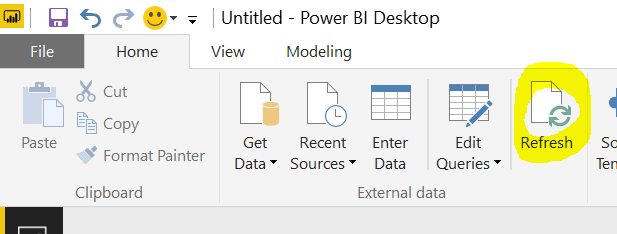
Power BI: Use the menu option "Refresh" under the "Home" tab to refresh the data
6. Query Name
The name of the query may be changed to something more meaningful than the default.
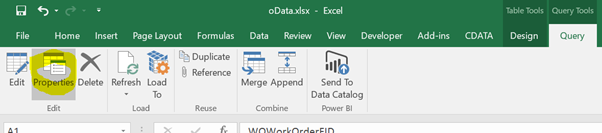
Excel: Change the query name via the menu option “Properties” in the “Query” tab.
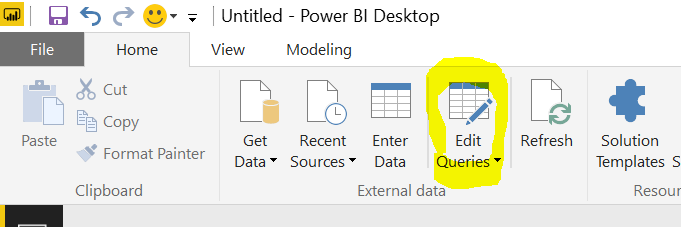
Power BI: Open the Query Editor dialog window from the "Home" tab via the "Edit Queries" button
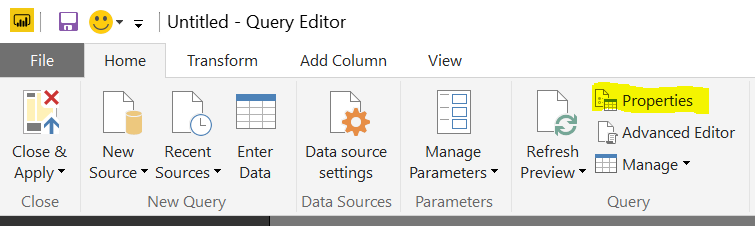
In the Query Editor dialog window choose the "Properties" button under the "Home" tab.
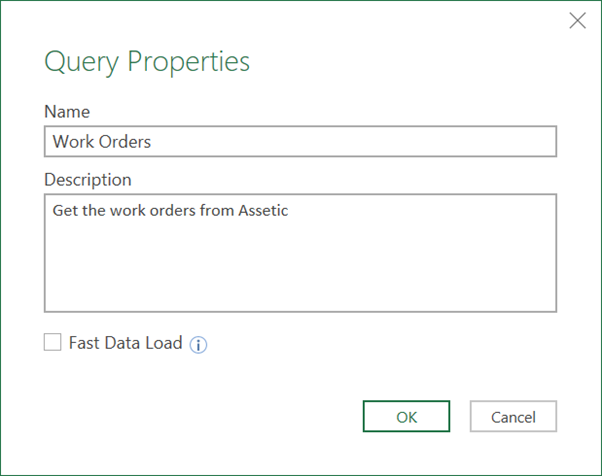
Excel and Power BI: A Query Properties dialog window will popup. In the example below the name of the query will be changed to “Work Orders” and a description of the query given.
7. Define the Number of Records to Return
The Assetic OData endpoint restricts the number of rows returned to a maximum of 10,000. OData query tools such as Microsoft Query may apply defaults that return less than this maximum.
The query needs to be edited via the "Query Editor" dialog window to set the number of records to return.
Excel: From the "Query" tab click on the "Edit" button
Power BI: From the "Home" tab click on the "Edit Queries" button
Excel and Power BI: The Query Editor dialog window will popup.
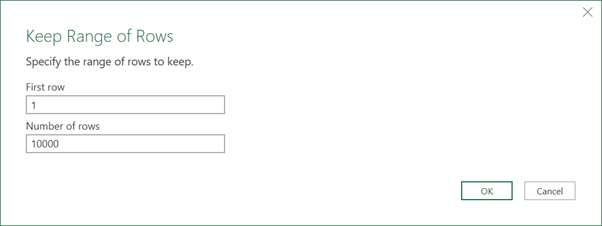
This is the same editor that was used initially to choose columns when the query was created. OData allows a range of fields to be selected, so to select the maximum 10,000 row limit, define the first row as 1, and the number of rows as 10,000
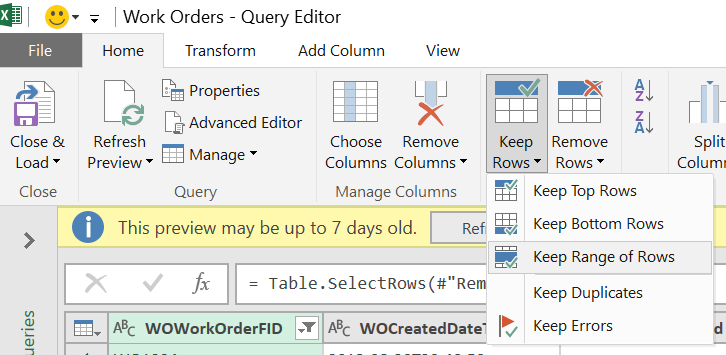
Excel: In the Query Editor dialog window "Home" tab choose the menu option "Keep Rows"->"Keep Range of Rows"
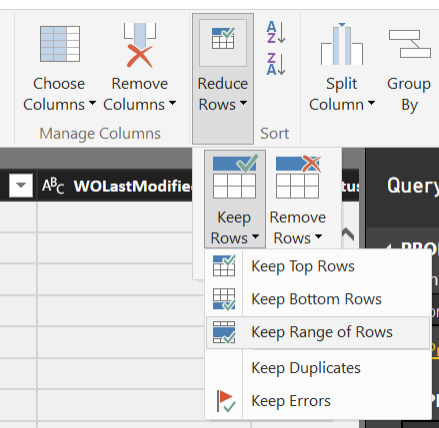
Power BI: In the Query Editor dialog window "Home" tab choose the menu option "Reduce Rows"->"Keep Rows"->"Keep Range of Rows".
Excel and Power BI: In the dialog window that pops up enter the first row and number of rows.
Choose “OK”, and then “Close and Load” in the query editor. The number of rows loaded will be 10,000 (unless there are less than 10,000 rows in Assetic).
NOTE it is possible to skip rows by changing the “First Row” to a number greater than 1, however the Assetic OData endpoint will only return the first 10,000 records, so if the “First Row” is set to 2,500 then the first 2,500 rows are not returned, and the next 7,500 records are returned (not the next 10,000 rows)
8. Search Filter
To reduce the number of records returned from Assetic, a search filter may be applied to the OData query. It is better to apply the filter in the query rather than the resultant data to reduce the data downloaded.
Open the Query Editor dialog window. In the Query Editor grid apply a filter in much the same way as in an Excel sheet, as shown below:
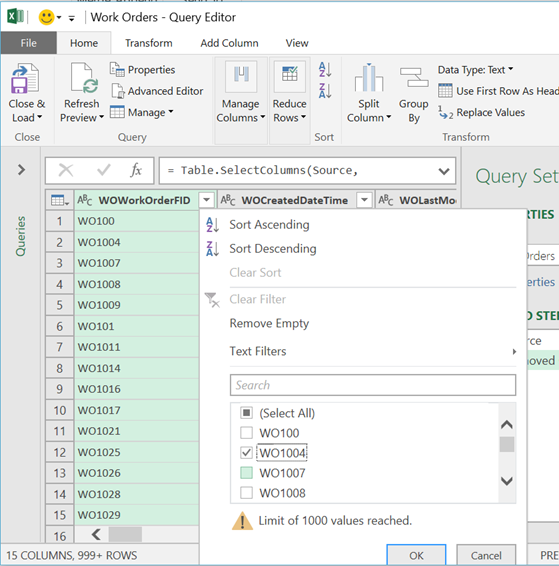
In the screenshot above the filter is chosen as “WO1004” on the work order ID column. Note however that Excel doesn’t show all possible work order numbers as there are too many to display.
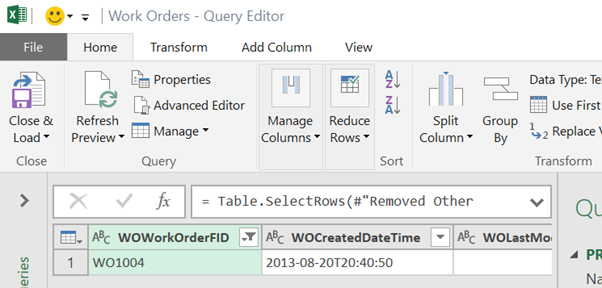
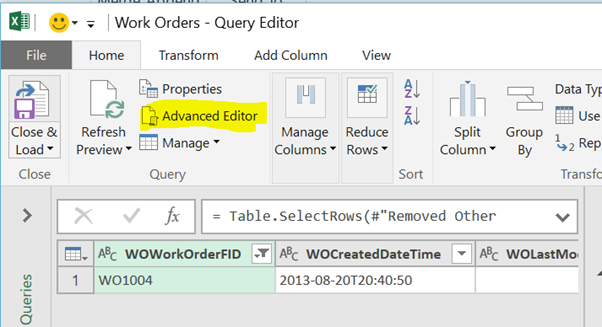
After clicking OK the preview grid in the Query Editor shows only the selected work order.
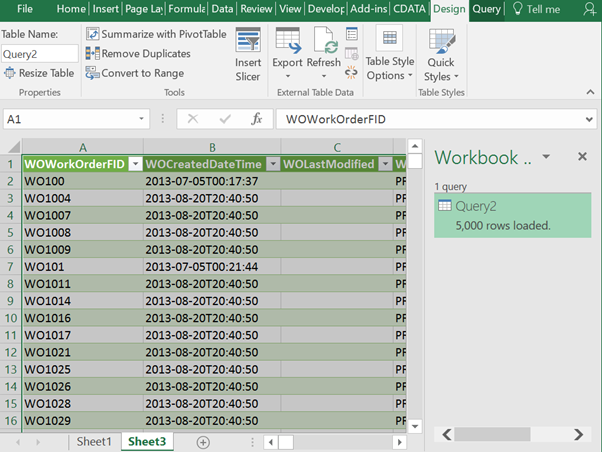
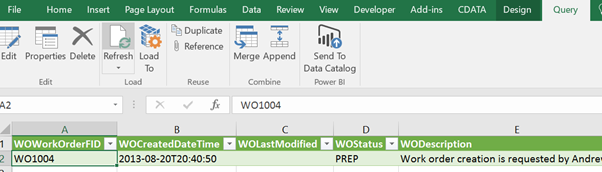
Choosing “Close and Load” in the Query Editor window will refresh the worksheet/report as shown below:
Excel: Choosing “Close and Load” in the Query Editor window will refresh the worksheet/report as shown below:
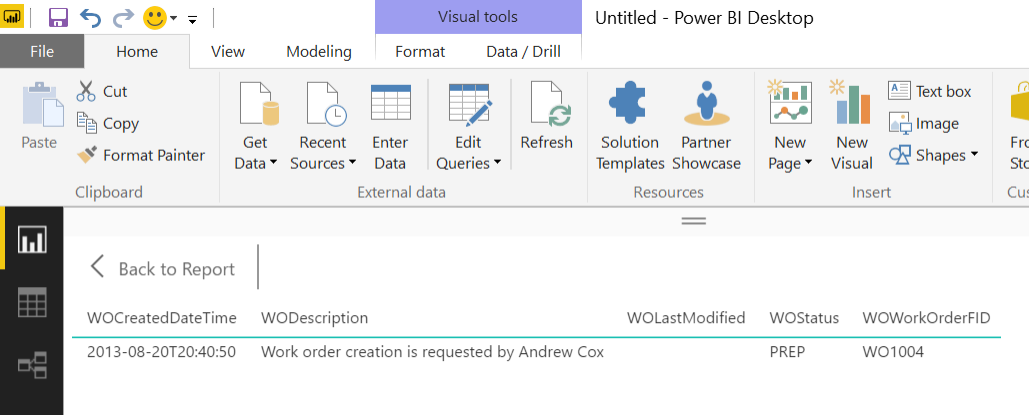
Power BI: Choosing “Close and Apply” in the Query Editor window will refresh the worksheet/report as shown below:
Apply Sorting
The OData search may also be refined by ordering the results. Ordering the results as part of the search means that all records in Assetic are first ordered and then made available to Excel/Power BI. If the ordering is not set as part of the search, then any ordering that you do in the Excel spreadsheet or Power BI report will only be on the downloaded records, and may not be on the entire Assetic dataset.
In the query editor window click on the column you wish to order by. Next click on the Ascending or Descending icon:
9. Setting Search Filter via Advanced Editor
The filter option from the example above has limitations such as where the number of filter options exceeds what can be listed. In that case, you can use the “Query Editor” tool titled “Advanced Editor”. First open the “Query Editor” and then choose the “Advanced Editor” option.
The “Advanced Editor” dialog window will open. The filter applied previously is highlighted.
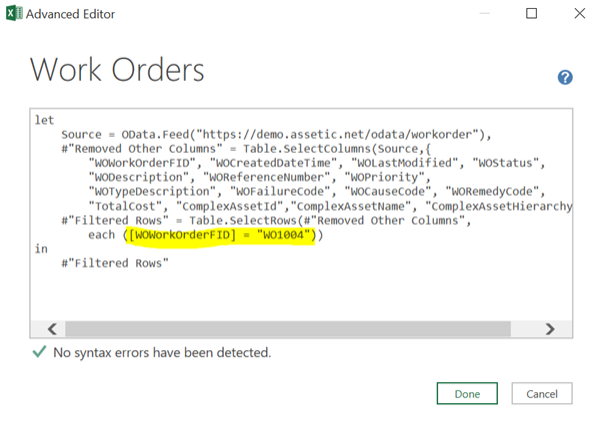
The filter value can be changed by typing in a new work order number within the double quotation marks, and selecting “Done”. This will close the “Advanced Editor”. In the Query Editor dialog window apply the query update and reload the data by selecting “Close and Load” (or "Close and Apply" in Power BI).
10. Setting Search Filter by Query Parameter
The previous filter examples have applied "hardcoded" filters to the search query. This means that each time you want to change the filter you need to edit the query. A more flexible alternative is to set a query "Parameter".
Open the Query Editor dialog window and choose the “Manage Parameters”->”New Parameter” menu option.
A “Parameters” dialog will open. Enter:
-
Name: The name of the paramter. A name that will mean something to you when presented with a list of parameter names)
-
Description: A description of the parameter
-
Required: Tick if it is mandatory (it usually will be)
-
Type: Usually will be Text
-
Suggested Value: As an example, if the parameter is for the different work order statuses then these coulds be entered in as a list to choose from
-
Current Value: This is the value that will be substitued into the query as the filter value. If “Required” has been ticked then a value must be entered at this time.
-
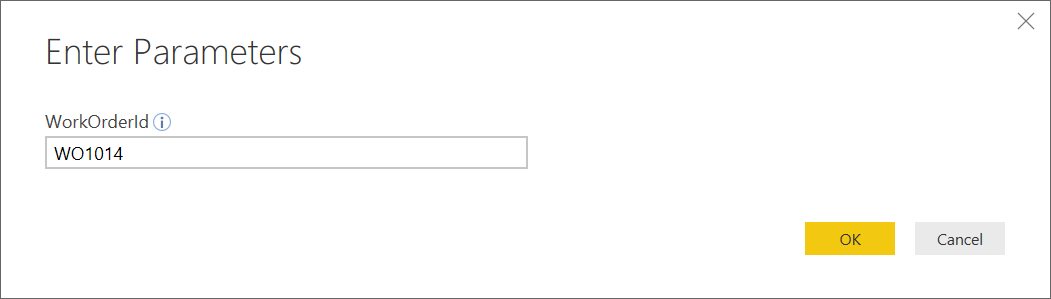
The following screenshot is an example of the filter for Work Order Id.
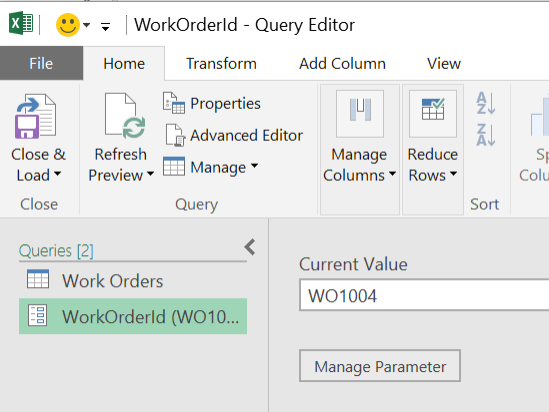
Click on the OK button. To save. The Query Editor will now list both the query “Work Orders” and the parameter “WorkOrderId”.
Click on the “Work Orders” query and then “Advanced Editor” to alter the query so that it uses the parameter instead of the value currently hardcoded in the query. In the screenshot below, the highlighted text is the name of the new parameter “WorkOrderId”:
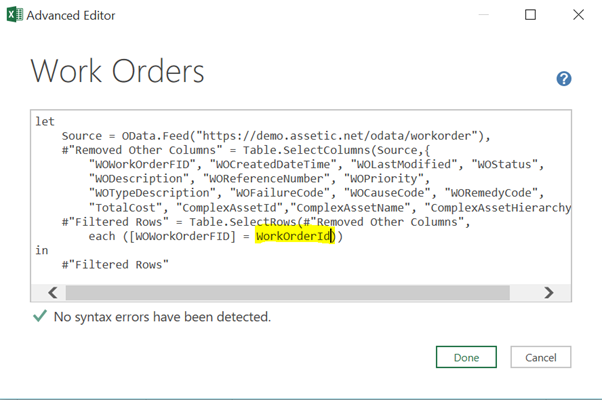
NOTE that the parameter is not within double quotes, unlike the hardcoded value.
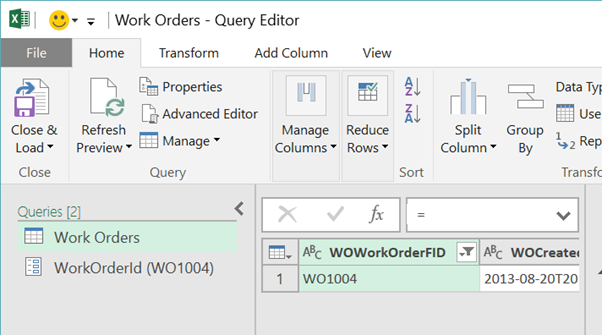
Apply the change by hitting the “Done” button. The Query Editor preview will refresh and display the work order defined in the parameter:
Excel: To change the value of the parameter double click on the parameter name, which is listed in the right hand pane along with the query name.
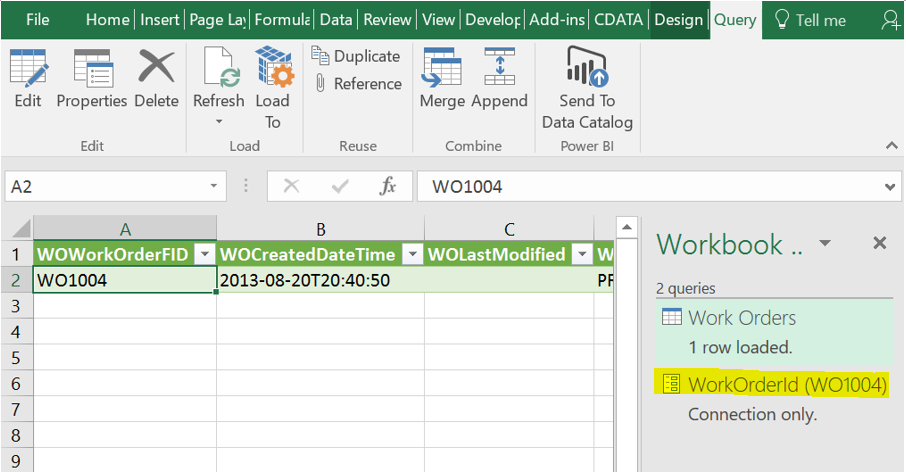
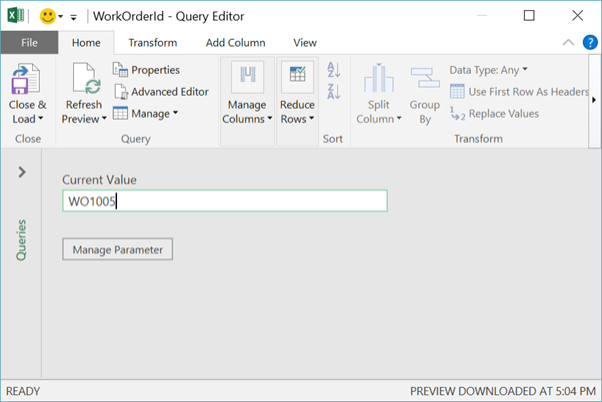
A new dialogue appears with the current value. Change the value and hit the “Close and Load” button to apply the new parameter.
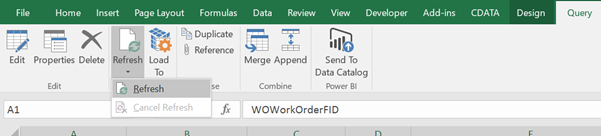
The spreadsheet will not refresh automatically, so from the “Query” tab click on the “Refresh” button and choose “Refresh” (see screenshot below).
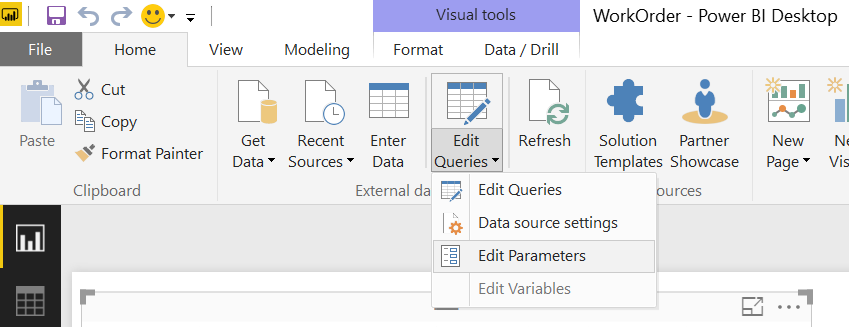
Power BI: To change the value of the parameter choose the "Edit Queries"->"Edit Parameters" menu option from the "Home" tab.
A new dialogue appears with the current value. Change the value and select "OK"
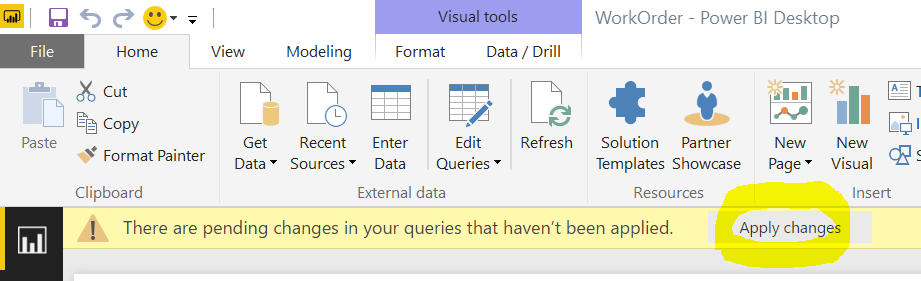
You will be prompted to refresh the query with the new parameter. Select "Apply Changes" and the report data will be refreshed based on the new filter.
Data Aggregation
OData supports data aggregation which allows you to group individual records and report at an aggregated level. This is more efficient than using the data aggregation capabilities of Excel or Power BI because:
If the Assetic OData aggregation is used, only the aggregated results are returned from Assetic to the reporting tool, meaning reduced data transfer.
The Assetic server is able to perform the aggregation in a optimised manner.
The Assetic OData endpoint restricts the number of records that can be downloaded to 10,000 records. This means not all data can be downloaded and aggregated using the report tool.
11. Create New Aggregation Query
Power BI and Microsoft Excel do not support the OData aggregation syntax, however there is an alternative. OData is simply a web service that has a defined structure, so the Power BI/Microsoft Excel 'Web' connection can be used instead.
The difference is that the URL entered for the web connection must include the aggregation query and selection fields because Microsoft Query is unable to construct these queries itself.
Excel: In a workbook go to the “Data” tab and choose the “New Query”->”From Other Sources”->”From Web” menu option.
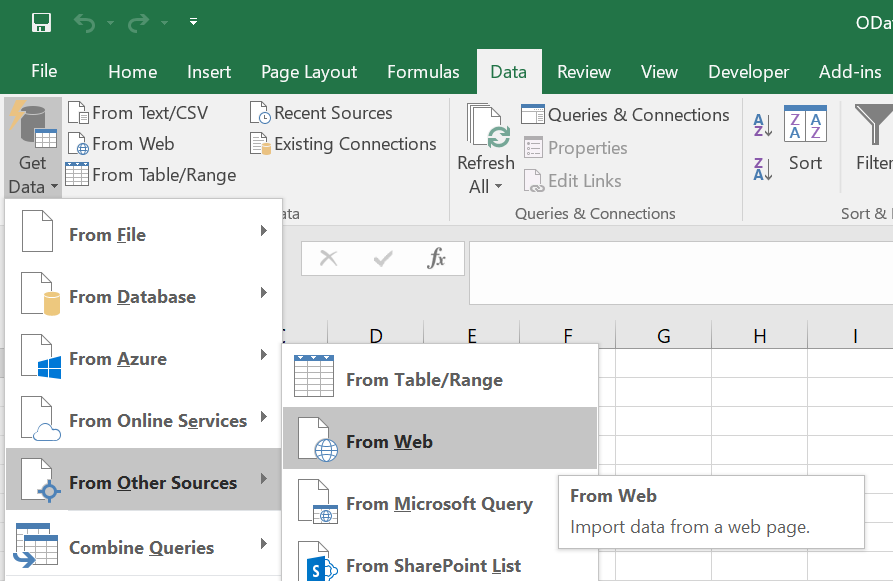
Power BI: In a new report go to the "Home" tab and choose "Get Data"->"Other"->"Web" and then click the "Connect" button.
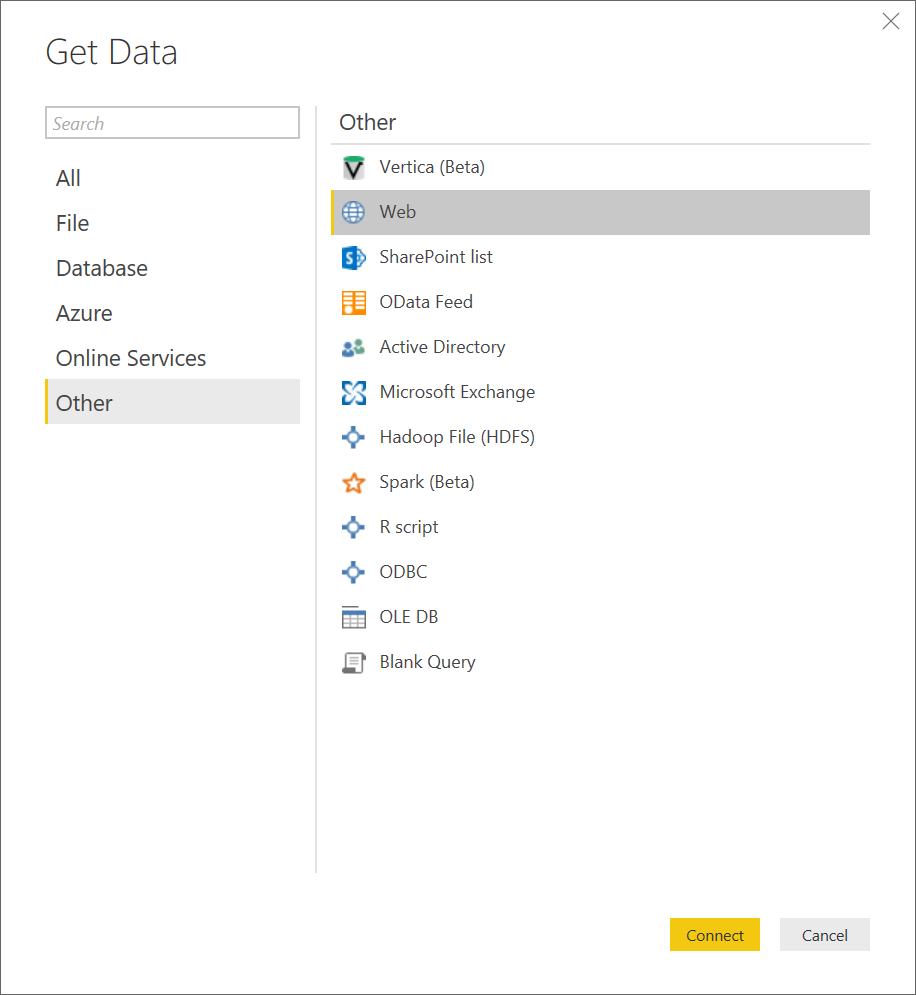
For both Excel and Power BI a “From Web” dialog window will pop-up after choosing the "Web" menu option. This is where the Assetic OData resource URL is entered.
The Assetic Knowledge Base article OData endpoint describes how to create an aggregation URL.
For this exercise, the Count Distinct section in article OData endpoint aggregation sample will be used:
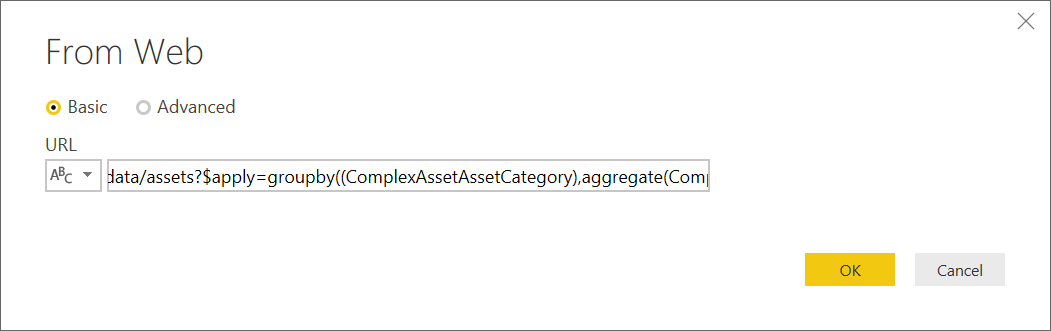
https://[your_env].assetic.net/odata/assets?
$apply=groupby((ComplexAssetAssetCategory),
aggregate(ComplexAssetId%20with%20countdistinct%20as%20Count))
Edit the above URL to replace [your_env] with your Assetic environment name and paste into the "From Web" dialogue as shown below:
After clicking on the OK button, Microsoft Query will connect to the Assetic OData endpoint. If you have not already authenticated to Assetic then you will be prompted to authenticate as per 2. Authentication to Assetic in this article.
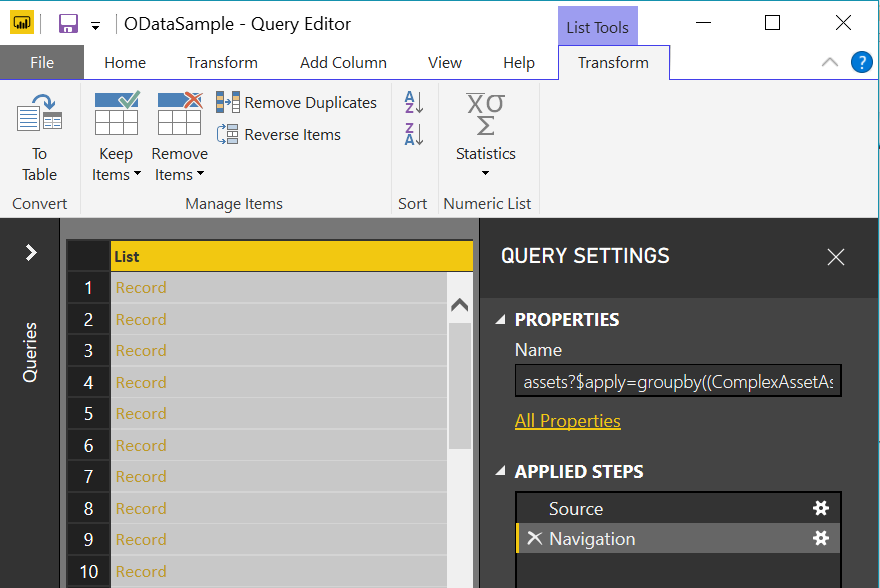
The "Query Editor" dialogue window will appear as shown in the screenshot below:
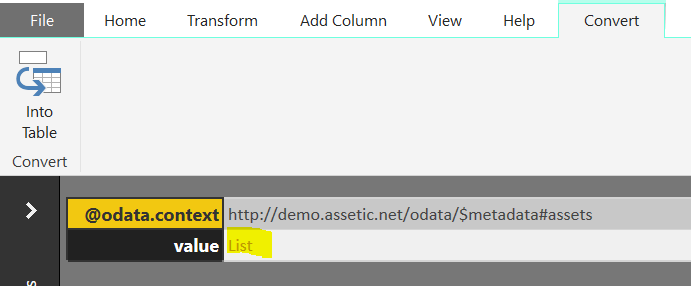
Click on the link "List" (highlighted in the screenshot above).
The "Query Editor" dialogue page will refresh and appear as per the screenshot below. You should see a line called "Navigation" in the "Query Settings"->"Applied Steps" pane on the right hand side of the "Query Editor" dialogue. You should also see a set of numbered rows with the value "Record" under the column heading "List".
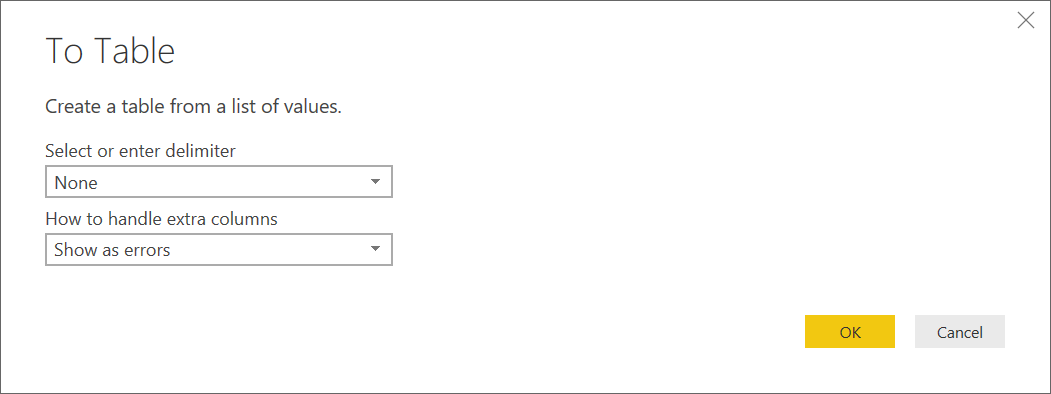
Click on the "To Table" button in the "Query Editor" dialog window. A new dialogue will popup titled "To Table". Click the "OK" button without making any changes.
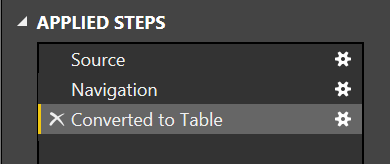
The "Query Editor" dialogue window will refresh again and in the grid show a column titled "Column1", with numbered rows having a value of "Record". The "Applied Steps" pane will have a new row titled "Converted to Table"
There will also be a small icon to the right of the column label "Column 1" (circled in the screenshot below).
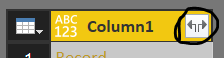
Click on the icon and a new dialogue will appear listing the fields from the OData Aggregration query:
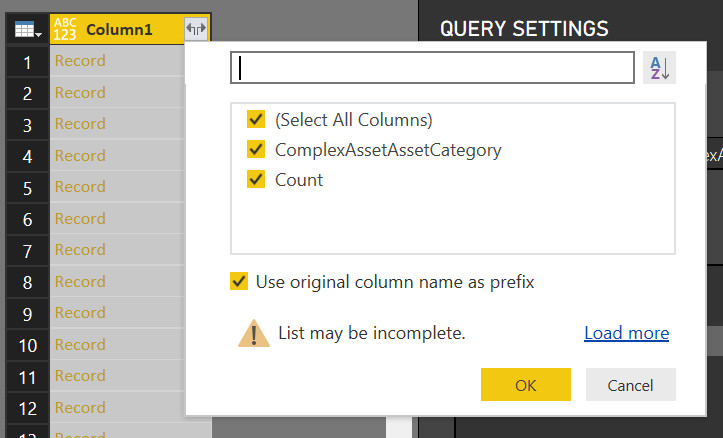
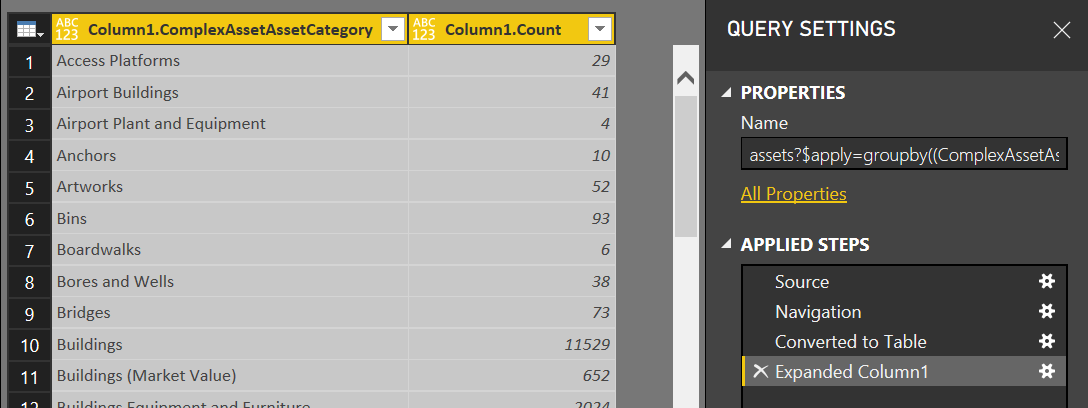
Accept the default settings by clicking the "OK" button. The results of the OData Aggregation Query will be displayed. In this instance a column with the Asset Category name, and a column with the number of assets in that category. The "Applied Steps" pane will display the final step "Expanded Column1"
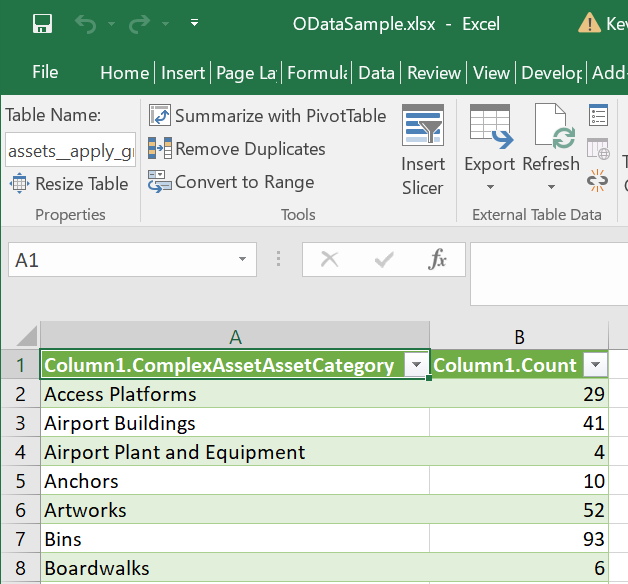
Excel: Use the "Close and Load" button to save your new aggregated data source.
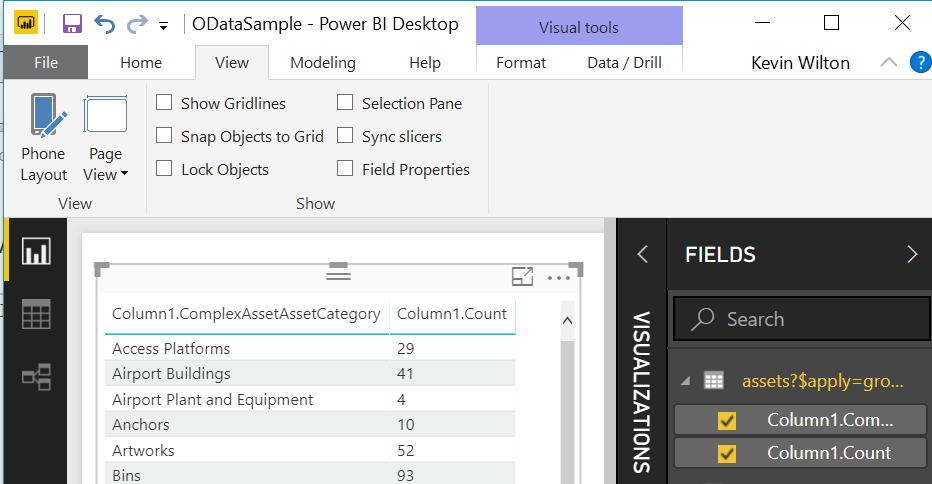
Power BI: Use the "Close and Apply" button to save your new aggregated data source. You can then drag the fields into a new grid to view.
Now that the query has been built and data returned the fields may of course be renamed, and the aggregation query renamed to something more meaningful. This is achieved using the typical methods for any type of query in Power BI or Microsoft Excel.
12. Change OData Source
You may need to change the Assetic OData source for your report. Reasons for this may include:
-
You are using the sample Excel Spreadsheet or sample Power BI report attached to this article. These reports can be used with your own Assetic data once you change the query source to point to your environment.
-
You have initially created the report against you Sandbox data and now want to report against your Production data.
Excel: From the Query Editor dialog window choose the menu option "Data Source Settings".
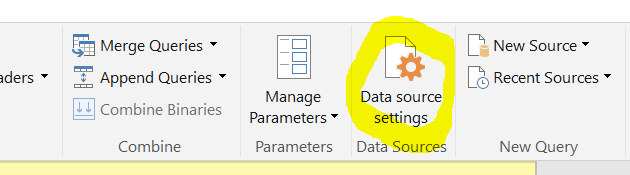
Power BI: From the "Home" tab choose the menu option "Edit Queries"-."Data Source Settings"
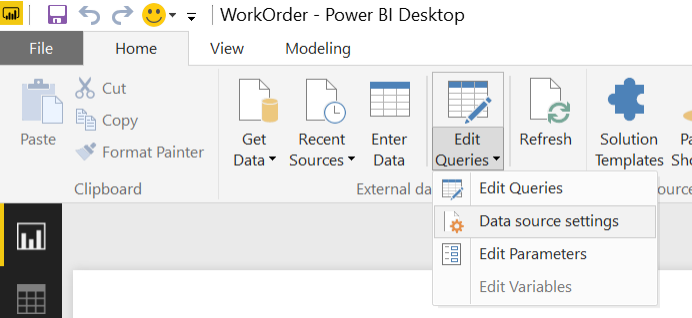
Excel and Power BI: The "Data Source Settings" dialog window will open.
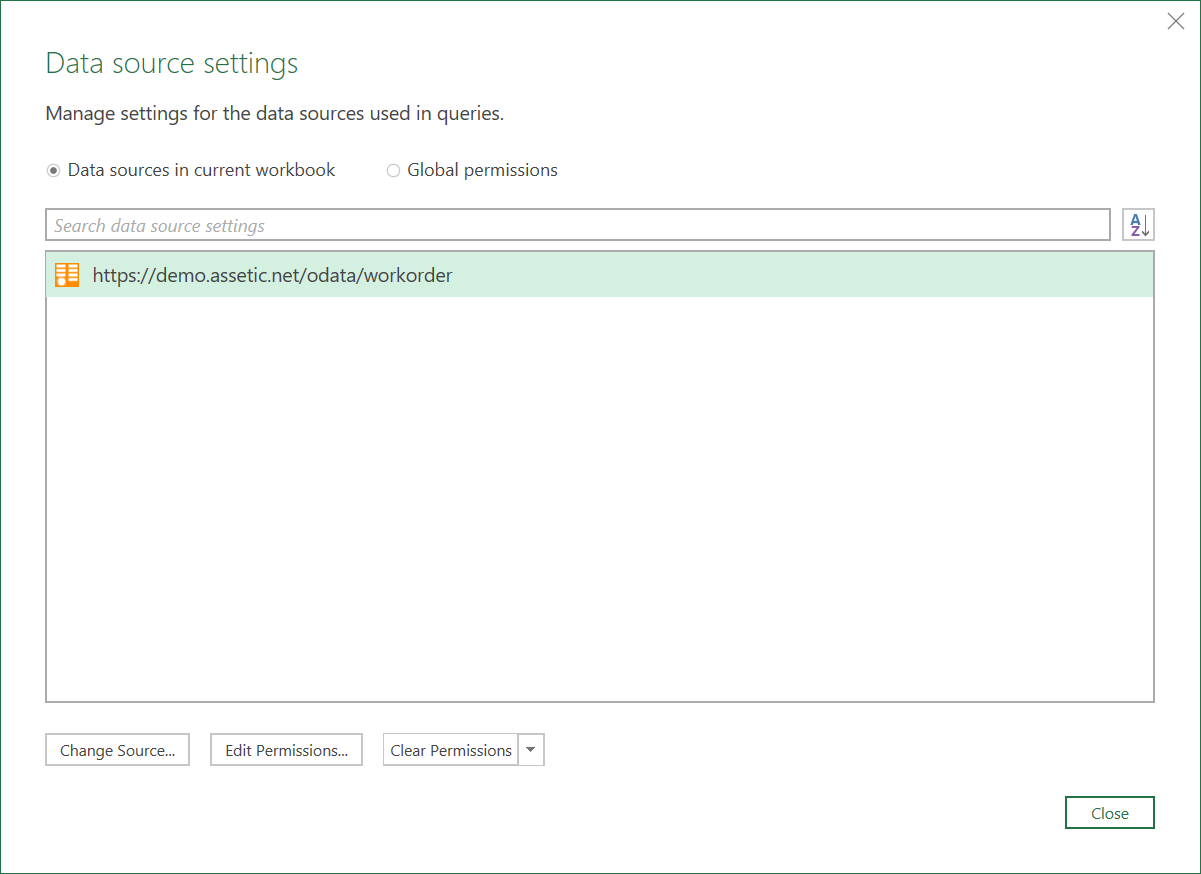
Highlight the OData endpoint you want to edit and then choose the "Change Source" button.
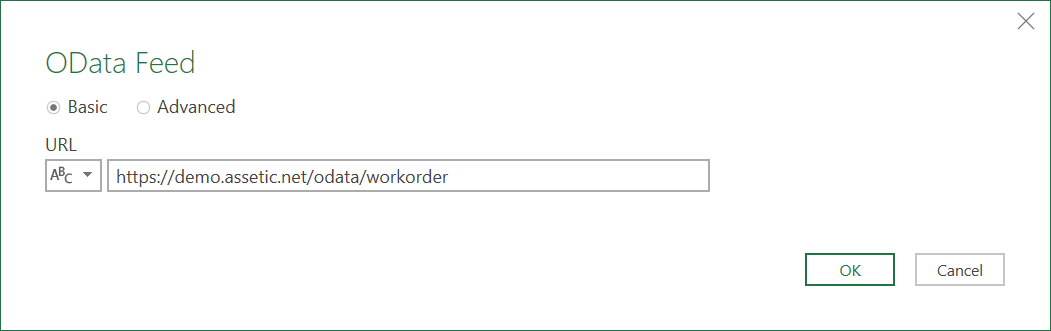
A new dialog window appears showing the current OData endpoint. Change the endpoint to your target Assetic environment. Once you have made the change choose "OK"
The report will need to be refreshed to load the data from your new environment, but you will first need to reset the authentication credentials to match your new data source.
13. Reset Authentication Credentials
If your credentials are not valid you will need to reset them. They may be for several reasons including:
-
You are using the sample Excel spreadsheet or Power BI report from this article.
-
You have changed your Assetic password
-
You have changed the report data source
To change your credentials first open the "Data Source Settings" dialog window (as shown in the section Change Odata Source).
Highlight the OData endpoint you want to edit and then choose the "Edit Permissions" button.

A new "Edit Permissions" dialog window appears. Choose the "Edit..." button in the "Credentials" section of the dialog window.
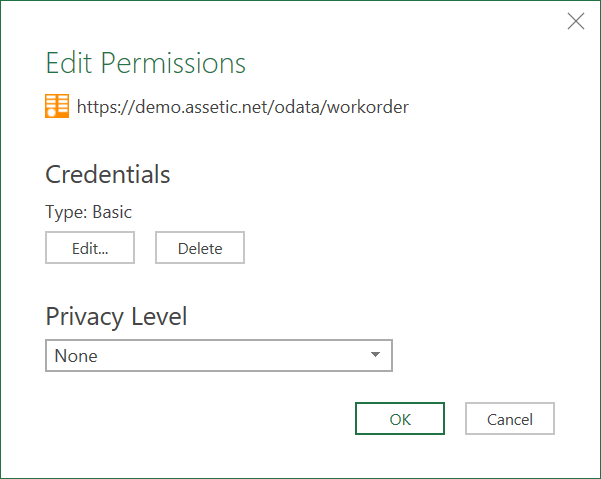
The same authentication dialog window that was used when the query was first created appears. Apply the changes and save.